The Fleeting Free Lunch of an Inverted Yield Curve
At a recent charity golf event, a tent sponsored by a national investment firm was set up at one of the tees. Curious and needing a diversion from my less than stellar golf game, I wandered over, both to meet the very affable representative and to see what he was offering. Impossible to miss on the table in front of him, in big, bold lettering, was a list of rates for “High Yielding CDs!” A couple of thoughts immediately raced through my head. First, “Wow, those are attractive rates!” Next, “When was the last time CDs were called “high yielding?”
As a bond manager involved daily in the market, I am painfully aware of how much rates have risen this year. But, not having looked at CDs in, well…forever, it just had not occurred to me that CD rates would be high enough to be used to attract new business. With market yields up more this year than any year since the early ‘80s, I had to look around to see if we had traveled back in time and my golf partners were wearing short shorts and knee-high socks.
The scene, of course, was a sign of just how dramatically things have changed in a short period of time. And as painful as this correction has been, the result is investors are once again recognizing the value in the fixed income markets. With the sharp rise in rates, bond and CD yields are the highest they have been since before the 2008 Global Financial Crisis.
To put things in context, at the time of this writing the Fed has raised the federal funds rate by 300 basis points this year (to a target range of 3.0% – 3.25%), with up to another 150 basis points expected before year end. Given this aggressive shift in monetary policy, short-term rates have risen more than longer-term yields. For reference, 10-year Treasury and AAA-rated tax-free municipal yields are up approximately 250 basis points and 210 basis points, respectively, since year end. Meanwhile, short rates, as measured by one-year maturity Treasury and AAA municipals, are up an incredible 410 basis points and 275 basis points, respectively, over the same period.
In fact, short-term Treasuries now yield more than longer maturities, putting the yield curve in an unusual, inverted position. How unusual? Prior to this year, there have been only three sustained periods of curve inversion since 1982, as measured by the 2s-10s yield spread. The chart below illustrates the three episodes, which lasted an average of 12 months. This means that over the last 40-year time span the curve has spent approximately three years in an inverted position, less than 8% of the time. Put differently, over 90% of the time the yield curve is upward sloping, requiring an investor to accept more interest rate risk to receive more yield. Not now! Currently, the proverbial “free lunch” is available in which less risk provides more reward!
Periods of Sustained Curve Inversion since 1982
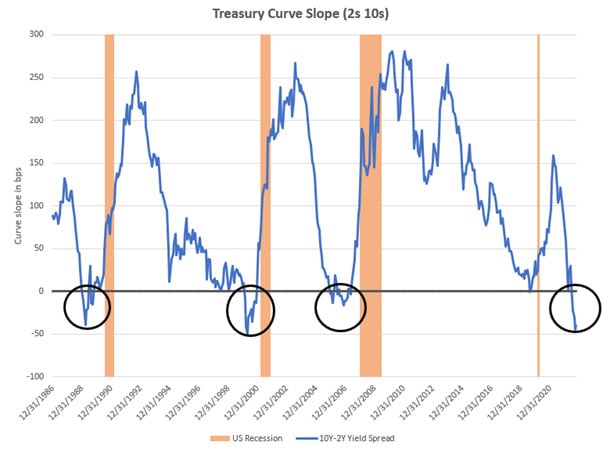
 Source: Bloomberg
I should not have been surprised that the registered representative selected CDs as the featured product on the golf course. Investors are once again able to earn an attractive return on cash near 3%, or short-maturity CDs with yields of 4.0%, or more.
So, What’s the Problem?
As appealing as this is, there is a risk that investors become too enamored with the free lunch. The appeal of short-term rates could cause someone to invest too much, too short and to stay too long at this short maturity lunch counter. They risk missing the bigger message – and opportunity – the inverted curve may be offering.
Historically, an inverted curve has been an important economic signal, warning of a looming recession. Yield curve inversions have preceded every recession since the 1970s – the only exception being the most recent very brief but deep, and unexpected, 2020 Covid-19 induced contraction in the economy. Inversions are caused by a tightening of monetary policy--by the Fed trying to slow an economy running too hot and/or inflation running too high. Ironically, however, it is the market’s confidence that the Fed will ultimately succeed in its mission that allows long-term rates to stay below short-term rates.
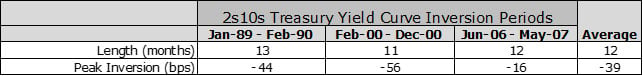
Even though the Fed has been broadly criticized in this cycle for waiting too long to tighten as inflation rose, the Fed’s credibility remains more than sufficient to create one of the deepest 2s-10s inversions on record. At its recent peak (Sept. 23), two-year yields were 53 basis points higher than 10-year yields. Of the three prior inversion periods, only the 2000 curve was more inverted, at -56 basis points. Also, with the average length of the inversion cycles being 12 months, if a similar pattern were to hold for this cycle, then we are already one-third of the way through it, as the 2s-10s curve became inverted in early July. This suggests that the curve should gradually steepen as we move through 2023.
A second important observation is the magnitude of the decline in both short- and long-term rates surrounding an inversion cycle. In each recession that followed the inversions, the Fed sharply lowered the federal funds rate, by an average of 575 basis points. Naturally, yields on money market instruments also plummeted.
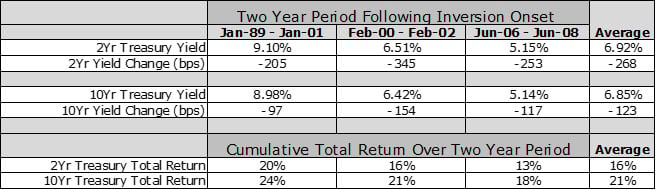
To consider the opportunity for investors, we looked at where two-year and 10-year Treasury yields were at the beginning of each inversion period and where they were two years later and asked how one would have fared had they invested in the 10-year maturity segment instead of the two-year. Not surprisingly, what we found is that yields on both curve segments fell sharply, producing very positive total returns for investors. Two-year and 10-year yields fell by an average of 268 basis points and 123 basis points, respectively. The cumulative total return for each over the two-year timeframe was 16% and 21%.
Treasury Yield Declines and Total Returns After Curve Inversions
For each inversion period, investors had a critical allocation decision to make, as they do today. In each cycle, they had the option of investing in a short-term vehicle, like a Treasury bill or CD, extending out to a longer maturity investment option, or some combination of the two.
The perceived free lunch, of receiving more reward (yield) for less (interest rate) risk by staying short was as tempting in each of the previous cycles as it is now. And while it appears as both the rational and optimalchoice, it was, in fact, the suboptimal selection from both a total return perspective and on a yield basis (i.e. the opportunity to lock in a relatively high-income stream for much longer). While some might say “cash is king,” now that yields are up. The more enlightened comment is “cash flow is king” --and the longer it flows, the better.
The real-time option for investors now is to invest in a one-year Treasury or CD-instrument yielding ~ 4.5%? Or accept more risk for less yield by moving a portion of the allocation out the curve a bit at ~4.0%? What would you do?
Is This Time Different?
Every cycle has its nuances, its own unique backdrop and characteristics. This one is certainly unique in that none of the previous cycles were preceded by a global pandemic which led to a nearly complete shut-down of the global economy for a time. Nor did the others feature the same supply chain issues and labor shortages we face today. Neither did previous cycles trigger the massive fiscal and monetary response, including the massive fiscal pandemic relief and $5 trillion expansion of the Fed’s balance sheet, both of which contributed to the already building inflationary pressures. There is also a view that we may be entering a new era in which some of the powerful disinflationary forces that supported previous Fed efforts to control inflation, such as globalization, favorable demographics and unprecedented technological changes, are slowing or even reversing.
Even if all the above is true, and it is not the goal of this paper to decide, we strongly believe business and economic cycles still exist—that, even if economic history doesn’t exactly repeat itself, it still rhymes. If the macro trends are gradually changing, the Fed remains an incredibly powerful actor that is determined to slow growth and cool the labor market while buying time for supply constraints to ease. We prefer to bet with the Fed rather than against.
We would, therefore, caution investors against staying too short. Everyone’s investment goals and objectives are different, and one should always consider their investing time horizon. That said, we would encourage the consideration of the perhaps less-intuitive investment opportunity that is now available and to move out the yield curve with at least a portion of their fixed income allocation.
Disclosures
Fixed income is generally considered to be a more conservative investment than stocks, but bonds and other fixed income investments still carry a variety of risks such as interest rate risk, credit risk, inflation risk and liquidity risk. In a rising interest rate environment, the value of fixed income securities generally declines and conversely, in a falling interest rate environment, the value of fixed income securities generally increases. High-yield securities may be subject to heightened market, interest rate or credit risk and should not be purchased solely because of the stated yield. Municipal securities may or may not be appropriate for all investors, especially for those in lower tax brackets. All investments carry risk, including loss of principal. Brokered CDs, which Baird offers, are different than those issued directly to investors by their bank and both are different than Treasury securities regarding investment characteristics including risk. Please consult with your financial advisor. Past performance does not guarantee future results.