
A World Full of Opportunities
Allocating to International Equities
Recent returns have been a powerful driver of flows into U.S. equities, and the temptation may be to stay stateside. But global markets are fluid and present a world of opportunities for return enhancement and diversification. In times like these, long-term investors should consider the potential benefits of maintaining an allocation to international equities.
Discover the Chautauqua International Growth Fund
U.S. and Non-U.S. Performance Leadership Changes Over Time
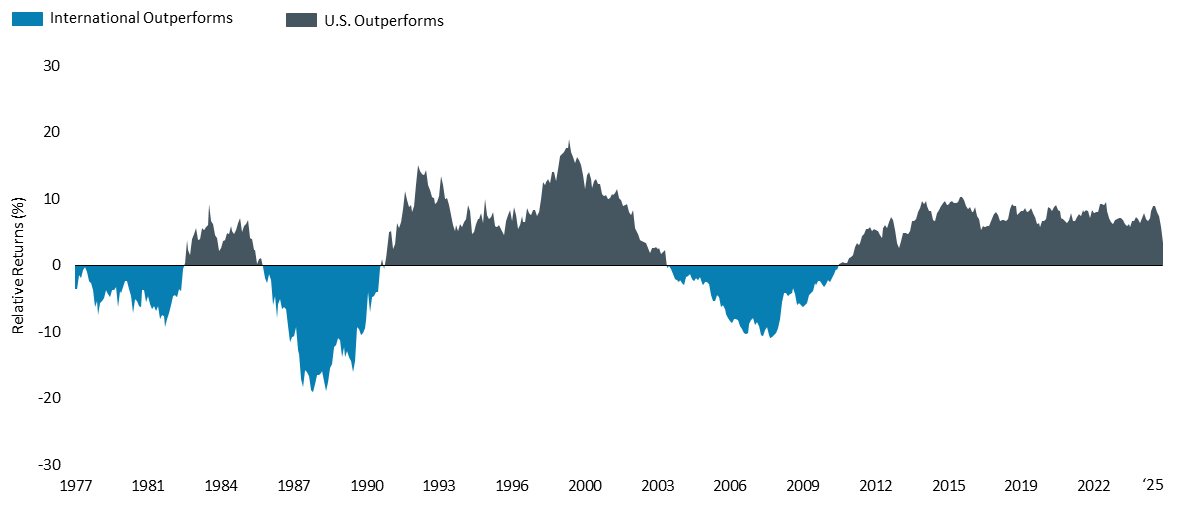
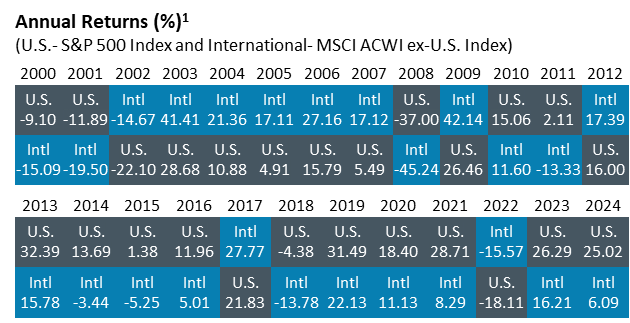 Reviewing annual returns since 2000 or five-year rolling returns since the 1970s highlights the fact that cycles of U.S. and international leadership tend to be long and varied. Prior to the most recent U.S. dominance, there was a long period of international outperformance in the 2000s and several years in the 1980s and 1970s. With the relative underperformance of international equities again approaching historical extremes in both duration and magnitude, experience indicates that international stocks are due to reclaim market leadership.
5-Year Rolling Returns2
(S&P 500 Index - MSCI World ex-U.S. Index)
Catalysts for Change
There are many strong market indicators emerging that could drive this shift, including historically high valuations for U.S. equities, higher projected growth rates for regions outside the U.S., and weakening of the U.S. dollar. We believe as these continue to take shape, it could lead to international equities outperforming U.S. equities in the near future.
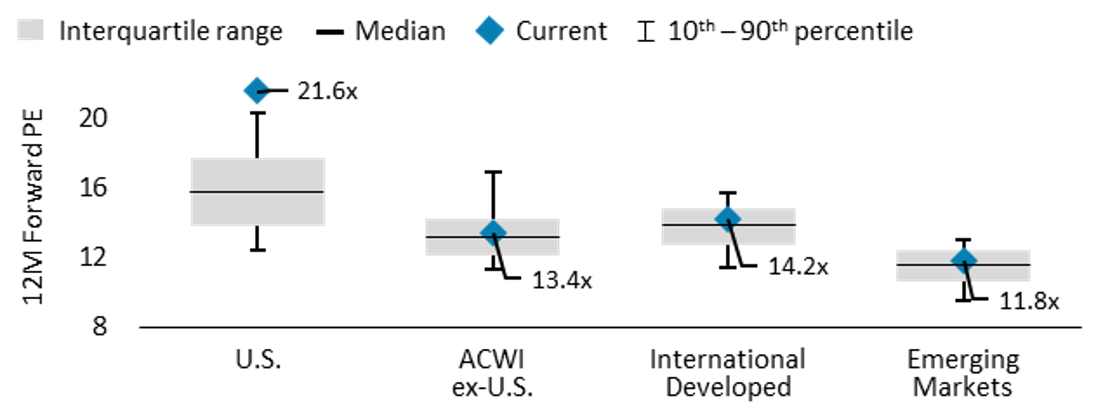
#1 - U.S. Equity Valuations Near Record Highs
Historically, there has been a strong link between starting valuations and subsequent long-term returns. U.S. stocks are approaching historical highs versus international stock valuations. Such extremes were also present at the beginning of international outperformance in the 2000s. Given elevated U.S. valuations relative to their own recent history and the valuation differential between U.S. and international markets today, the case for international investing is appealing.
Valuation Ranges Across Regions3
(12-Month Forward P/E, January 2006 – April 2025)
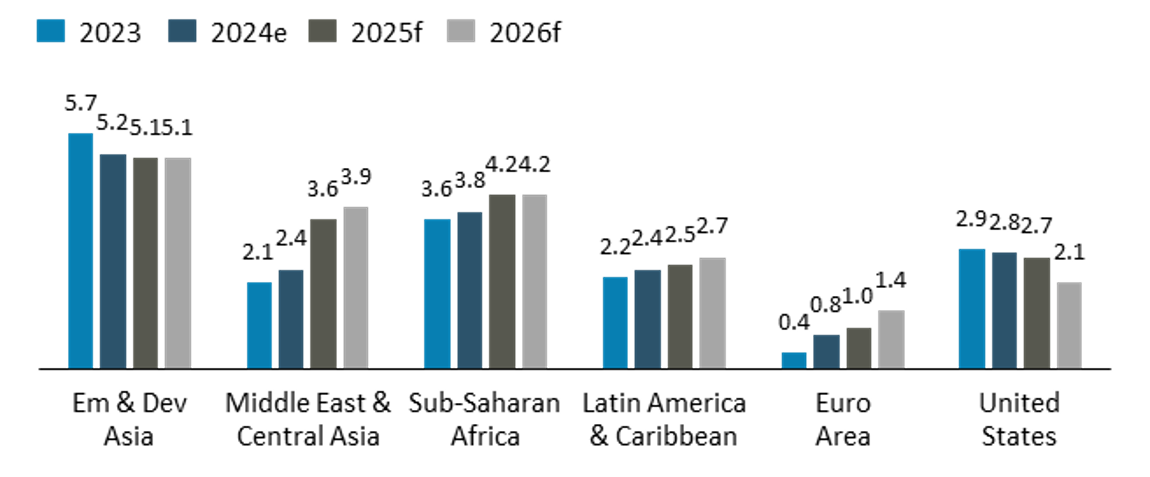
#2 - Growth Varies Around The World
Projected elevated growth rates in non-U.S. countries provide favorable prospects to capitalize on potential future growth. Despite being underrepresented in the global index, many other countries outside the U.S. contribute to global production and growth. Approximately 96% of the world’s population, 84% of the world’s economic activity, and 65% of public companies with market capitalizations greater than $5 billion are located outside the U.S. Data indicates many countries offer superior growth opportunities relative to the U.S.
Growth Projections by Region4
(Real GDP Growth %)
#3 - U.S. Dollar Volatility
The periods from 1994 to 2001 and post the Great Financial Crisis share common factors that contributed to demand for the U.S. dollar, including Federal Reserve Policy, U.S. economic growth, foreign capital inflows into the U.S., relative political stability, and technological innovation. U.S. equities generally outperformed in these periods.
Variables changed in the early 2000s, leading to a weakening U.S. dollar and resulting in outperformance of international equities. The next cycle may see volatility in the U.S. dollar, and diversifying a portion of assets into international equities may be a reasonable strategy.
U.S. Dollar Strength vs. Calendar Year Relative Return5
(MSCI ACWI ex-U.S. Index - S&P 500 Index)

A World Full of Opportunities
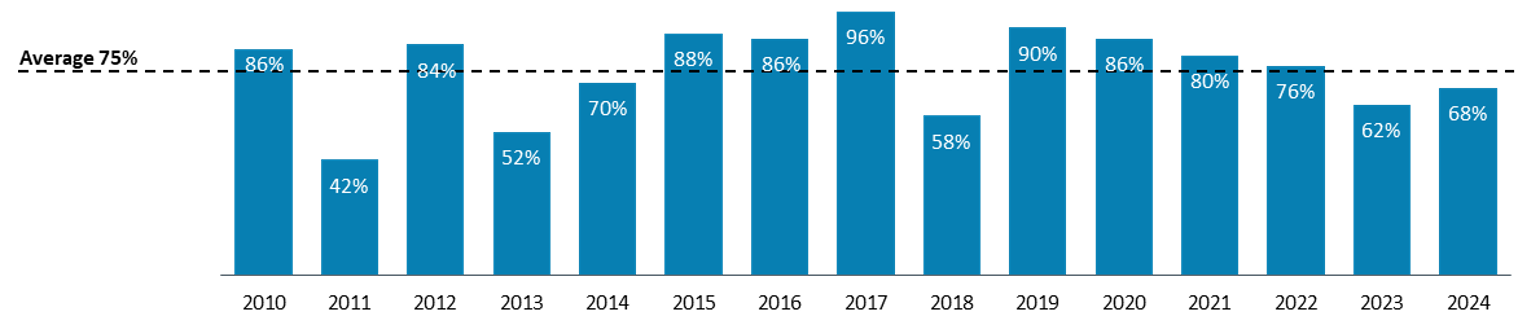
Investing in only U.S.-based companies significantly limits the opportunity set for investors. In fact, on average over the last 14 years, 75% of the 50 top performing stocks in the MSCI ACWI Index were non-U.S. stocks.
Percent of Top 50 Performing Stocks Based Outside of the U.S.6
(in the MSCI All Country World Index)
Chautauqua Capital: Finding Advantaged Companies for the Long Term
We seek to uncover wealth-generating companies using in-depth fundamental analysis on a company-by-company basis and invest with a long time horizon. At Chautauqua, we search for companies that:
- Benefit from durable, long-term trends
- Possess competitive advantages that enable them to potentially secure a significant portion of the profits created by those trends
- Can be purchased at reasonable valuations
Rolling Five-Year Returns Since Inception7
04/30/2021 to 04/30/2025 (monthly, USD)
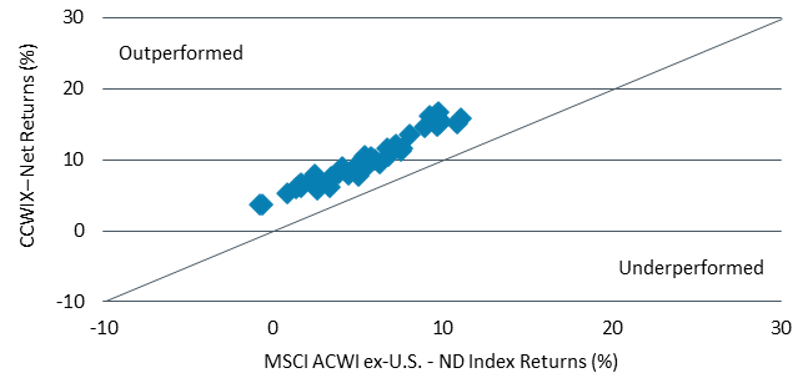
The Baird Chautauqua International Growth Fund (CCWIX) has historically provided investors international diversification with faster growth, more profit, and less leverage than the MSCI ACWI ex-U.S. Index. The fund has outperformed the index over rolling five-year periods since inception.
Fund Performance
(as of 06/30/2025)
| Average Annual Total Returns (%) | |||||
| 1 Year | 3 Year | 5 Year | Since Inception* | Expense Ratio (Net/Gross) | |
| International Growth Fund Institutional Class (net) |
18.75 | 14.04 | 10.76 | 9.94 | 0.80%/0.84% |
| International Growth Fund Investor Class (net) |
18.49 | 13.78 | 10.47 | 9.66 | 1.05%/1.09% |
| MSCI ACWI ex-U.S. Index - ND | 17.72 | 13.99 | 10.13 | 7.64 | -- |
*Inception date: April 15, 2016.
Performance data represents past performance and does not guarantee future results. The investment return and principal value of the investment will fluctuate so that shares, when redeemed, may be worth more or less than their original cost. Current performance data may be lower or higher than the data quoted. For performance data as of the most recent month-end, please visit bairdfunds.com. The Net Expense Ratio is the Gross Expense Ratio minus any reimbursement from the Advisor. The Advisor has contractually agreed to waive its fees and/or reimburse expenses at least through April 30, 2026, to the extent necessary to ensure that the total operating expenses do not exceed 1.05% of the Investor Class's average daily net assets and 0.80% of the Institutional Class's average daily net assets. Investor class expense ratios include 0.25% 12b-1 fee.
International/Global Growth Investment Team
For more information regarding how Chautauqua can help add value to your investment lineup, please contact us:


1Source: eVestment.
2Sources: Bloomberg and eVestment; monthly 5-year rolling returns. U.S. outperformance represented by S&P 500 Index; International outperformance represented by MSCI World ex-U.S. Index.
3Source: Bloomberg; U.S. is S&P 500 Index, ACWI ex-U.S. is MSCI ACWI ex-U.S. Index, International Developed is MSCI World ex-U.S. Index and Emerging Markets is MSCI Emerging Markets Index.
4Source: International Monetary Fund, World Economic Outlook Update, April 2025
5Sources: FactSet, eVestment. U.S. Dollar value determined by the ICE U.S. Dollar Index - Price. Calendar years outperformance and percentage outperformance (cumulative) calculated using MSCI ACWI ex-U.S. Index versus S&P 500 Index.
6Sources: FactSet, eVestment. Top performing 50 stocks based on companies in the MSCI All Country World Index.
7Source: APX.
Investors should consider the investment objectives, risks, charges and expenses of the fund carefully before investing. This and other information can be found in the prospectus or summary prospectus. A prospectus or summary prospectus may be obtained by visiting bairdfunds.com. Please read the prospectus or summary prospectus carefully before investing.
The Fund may hold fewer securities than other diversified funds, which increases the risk and volatility because each investment has a greater effect on the overall performance. Foreign investments involve additional risks such as currency rate fluctuations and the potential for political and economic instability, and different and sometimes less strict financial reporting standards and regulations.
The S&P 500® Total Return Index is an unmanaged, market capitalization-weighted index of 500 common stocks widely regarded to be representative of the U.S. market in general. Returns include reinvestment of dividends. The MSCI World ex-U.S. Index® is a free float-adjusted market capitalization-weighted index that is designed to capture large- and mid-cap representation across 23 developed market countries excluding the United States. The MSCI ACWI ex-U.S. Index® is a free float-adjusted market capitalization-weighted index that is designed to capture large- and mid-cap stocks across 22 of 23 developed markets countries, excluding the United States, and 24 emerging markets countries. The MSCI Emerging Market Index® is a free float-adjusted market capitalization-weighted index that is designed to capture large- and mid-cap stocks across 24 emerging markets countries. Indices are unmanaged and direct investment is not possible.
The MSCI information may only be used for your internal use, may not be reproduced or disseminated in any form and may not be used as a basis for or a component of any financial instruments or products or indices. None of the MSCI information is intended to constitute investment advice or a recommendation to make (or refrain from making) any kind of investment decision and may not be relied on as such. Historical data and analysis should not be taken as an indication or guarantee of any future performance analysis, forecast or prediction. The MSCI information is provided on an “as is” basis and the user of this information assumes the entire risk of any use made of this information. MSCI, each of its affiliates and each other person involved in or related to compiling, computing or creating any MSCI information (collectively, the “MSCI Parties”) expressly disclaims all warranties (including, without limitation, any warranties or originality, accuracy, completeness, timeliness, non-infringement, merchantability and fitness for a particular purpose) with respect to this information. Without limiting any of the foregoing, in no event shall any MSCI Party have any liability for any direct, indirect, special, incidental, punitive, consequential (including, without limitation, lost profits) or any other damages. (www.msci.com)
©2025 Morningstar. All Rights Reserved. The information contained herein: (1) is proprietary to Morningstar and/or its content providers; (2) may not be copied or distributed; and (3) is not warranted to be accurate, complete or timely. Neither Morningstar nor its content providers are responsible for any damages or losses arising from any use of this information.
Baird Funds are offered through Robert W. Baird & Co., a registered broker/dealer, member NYSE and SIPC. Robert W. Baird & Co. also serves as investment advisor for the Fund and receives compensation for these services as disclosed in the current prospectus. ©2024 Robert W. Baird & Co. Incorporated. First use: 06/2024